@marce said in Interweave two texts:
Then? I click, but nothing happens.interwine.vstyler
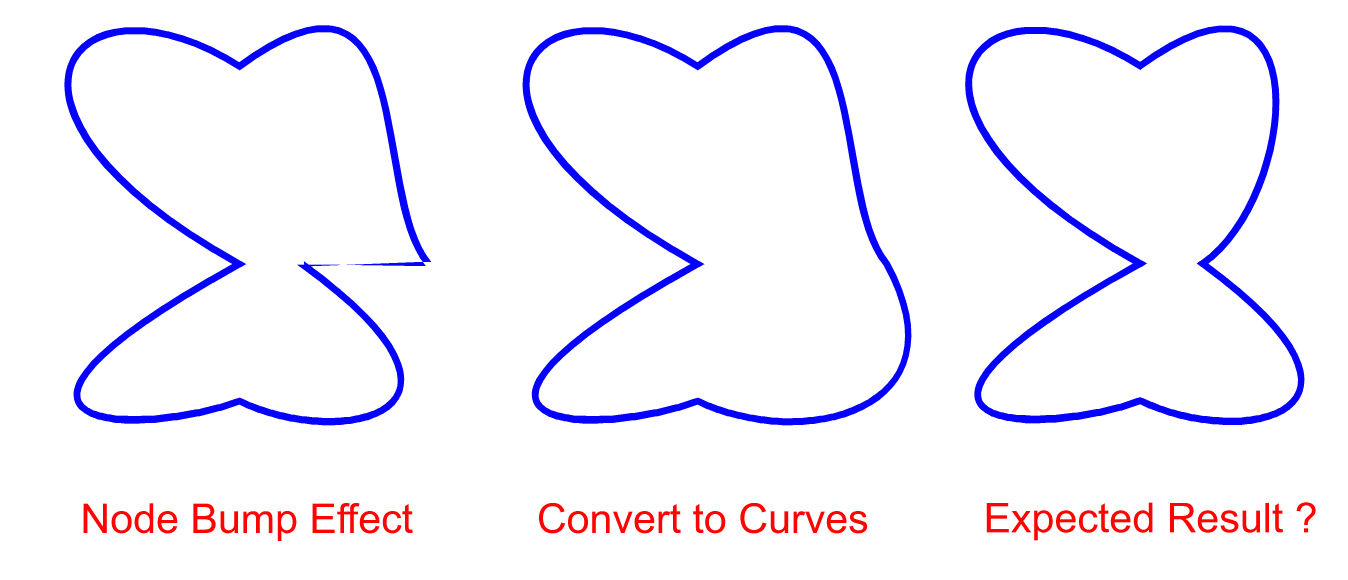
This is because the orange shape is an open path (non-closed shape)
I've checked and can confirm it's working now, but I came across this thread because I was also having this problem. I'll let you know if the problem returns.
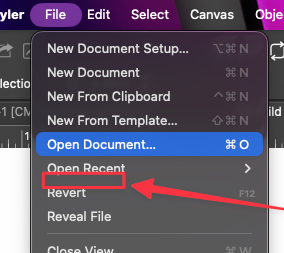
@Boldline In Settings->Other Options there is a "Paste with Artboard Position" that must be turned on.
Should there be separate actions with this option enabled?
The problem is that there are multiple actions (including Paste on All Artboards) that must be duplicated for this
@monsterfox Any Adobe Illustrator based formats (old or new) can only be imported, not exported in VS.
I will investigate how close the old AICB clipboard format is to Postscript, as Postscript or EPS export is possible.
@VectorStyler yes, whatever name fits best in your system. Essentially it would allow the file to be modified but not automatically saved. Perhaps the only save option in that situation is manually with a “save as” only? Whatever you think is best.
I more or less replicated a pattern I found online.
I couldn't resist using the "Along Stroke" feature
in VectorStyler's gradient editor.
[image: 1785256256579-rounded-quad-small.png]